The StoryGraph
Originally Posted 4/3/24

In Depth Review
This is going to be a pretty quick post, mostly to just get something posted in this category, but to also
talk about a cool app. The StoryGraph is a program to use instead
of Goodreads. I've not personally used Goodreads before, so I can't quite do a compare and contrast, however from
my experience with The StoryGraph, I'm really happy.
If you've not heard of GoodReads or The StoryGraph before, they are programs you can use to keep track of your reading.
In The StoryGraph at least (and I assume in GoodReads too), you can make a to read pile, and keep track of how much you read.
You can also see suggestions for other books, or create group reads to read something with friends, as well as I believe they
also just have a broader book reading community you could join in on (though I'm not 100% on that one). I personally
like it because it gives me a spot to keep track of books I want to read, as well as I just love any sort of data I can
look at, and having data to look at based on my reading actually motivated me to start reading more this year. You can
also write reviews for books you've read if you wanted, or see things your friends have read.
An example of my stats so far this year:
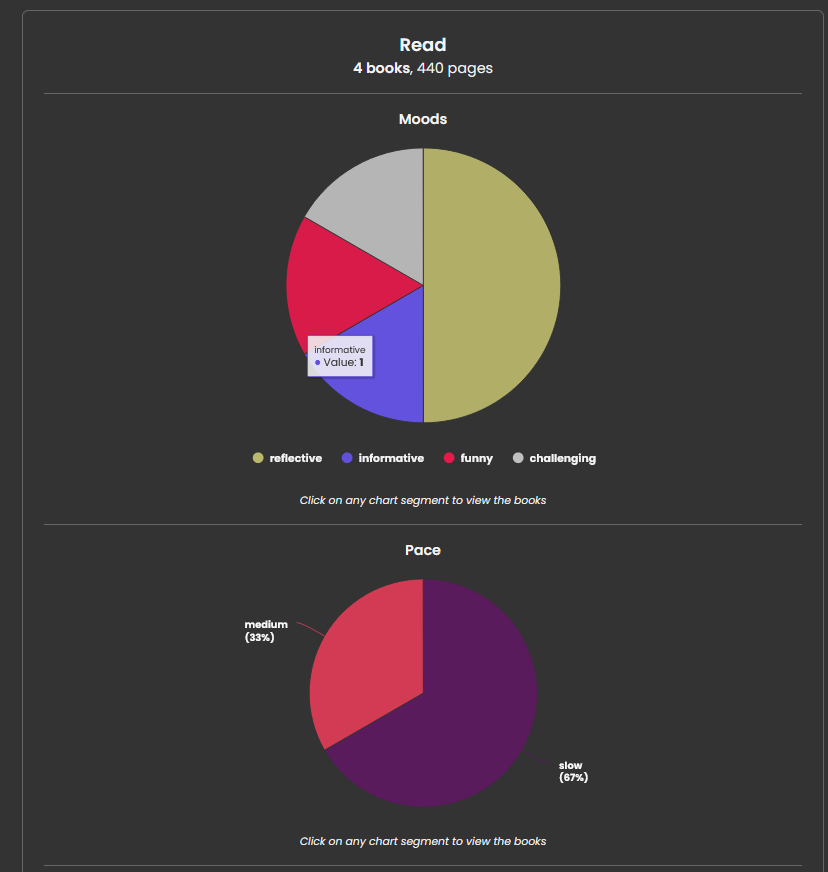
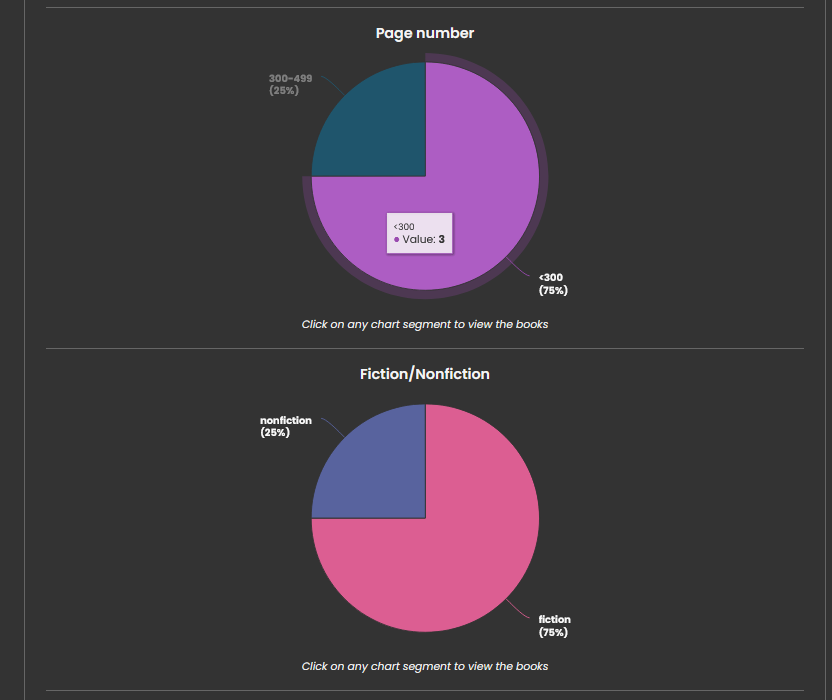
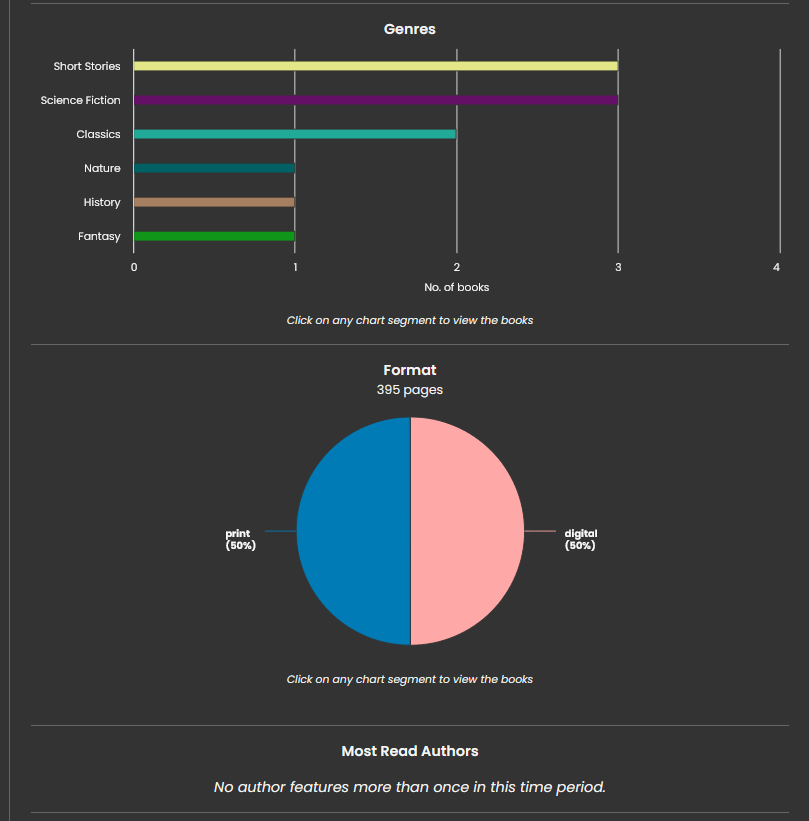
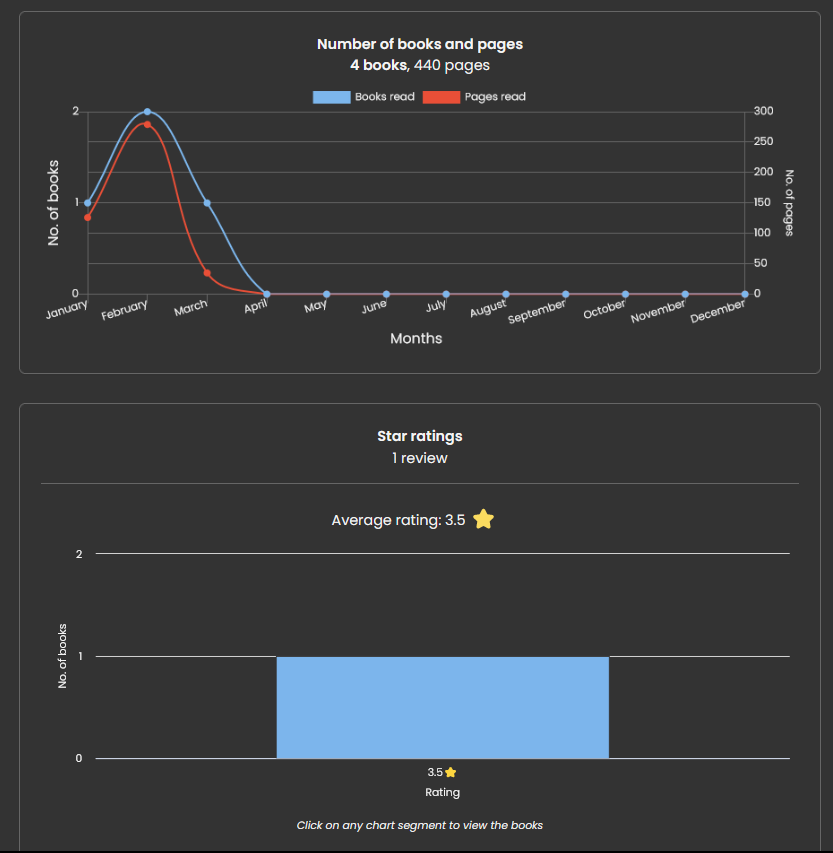
As you can see, I've not read much. However, this is more than I've read in many years past, so I'm pretty happy with it.
Wrap Up
Overall, I just really wanted to write about StoryGraph as I really try to not use Amazon as much as possible, and so
having an alternative to GoodReads feels good. I want to write more blog articles here about the books and other readings
I've done so far this year, but first wanted to talk about this. If you have any thoughts or questions or suggestions, feel
free to send them over to steventanzimedia@gmail.com. As always, thanks
for reading.